AI Video Analytics for Retail Queue Management: A Horus Simulated Walkthrough
Retail queue management is no longer just a customer-service issue. It is a revenue, staffing, and operations problem. In Waitwhile's 2024 consumer survey, 85% of consumers reported waiting in line at least several times per month, and retail remained the industry where people waited most often. The same report found that time spent waiting in retail lines had increased 61% since 2022 and 22% since 2023. Facit's retail queue summary adds a sharper commercial warning: 73% of shoppers would abandon a purchase if they had to queue for more than five minutes.
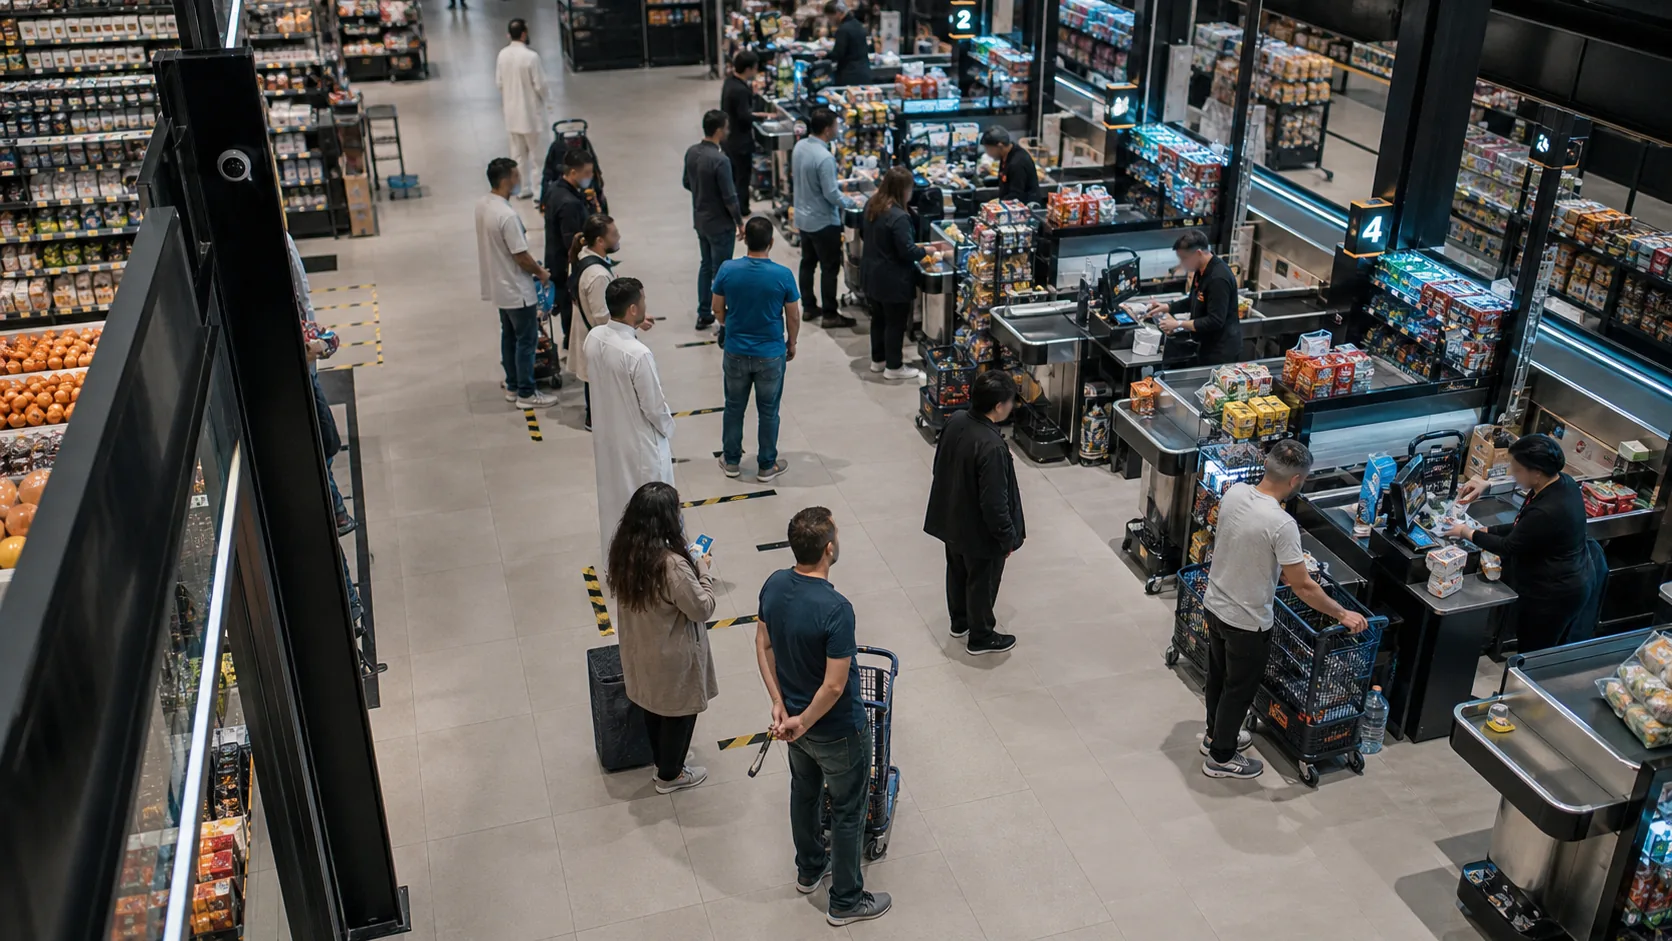
For MEA and Gulf retailers, where malls, supermarkets, pharmacies, cafes, and convenience formats often operate with existing CCTV coverage, the operational question is direct: can the cameras already watching the checkout area warn staff before the queue becomes a lost-sale problem? Here's what Horus detects when we simulate this scenario.
Disclaimer: This article describes a hypothetical demonstration using Horus in a simulated operational environment. All scenarios are illustrative only. The browser session could not reach the local edge video stream during capture, so this article does not show product screenshots for the simulated queue event. Event timings, confidence scores, and queue counts below are explicitly modelled for the walkthrough rather than presented as a live customer case study.
The Scenario Setup
The simulated store is a mid-size supermarket in the GCC/MEA region with existing IP cameras pointed at the checkout area. The store already uses CCTV for visibility, but queue response is manual: a supervisor notices congestion, radios for another cashier, or opens a second till when the queue is already visible to shoppers.
In the Horus setup, the checkout lane is treated as a queue zone. The simulated rule is simple: if the queue reaches eight people for more than 12 seconds, Horus raises a medium-severity queue-depth alert. The goal is not to replace staff judgement. The goal is to reduce the delay between "the queue is becoming a problem" and "someone who can fix it knows."
The Research Baseline
The problem is measurable. Waitwhile reports that retail queues are more frequent than queues in other consumer industries, and that Americans spend more time waiting in retail stores than at pharmacies, restaurants, banks, doctors' offices, and airports combined. The same survey says nearly 40% of consumers who avoid businesses because of lines either go to a competitor or do not buy anything at all.
Facit's queue summary reports three useful thresholds for operators: 25% of shoppers would wait no longer than two minutes, 59% would wait no longer than four minutes, and 73% would abandon a purchase after more than five minutes in a queue. A retail queueing technology field study also gives an important caveat: queue technology is not magic in low-traffic stores with short waits, but it becomes more useful in high-frequency stores where wait times are long enough to affect the experience.
For the broader retail risk context, the British Retail Consortium's 2025 Crime and Shrink Benchmark reported that customer theft cost UK retailers GBP2.2 billion in 2023/24 and that retailers spent GBP1.8 billion on prevention. That is not a queue statistic, but it shows why retailers keep investing in cameras and in-store operational visibility. Queue analytics is one way to make the same camera estate operationally useful, not only reactive.
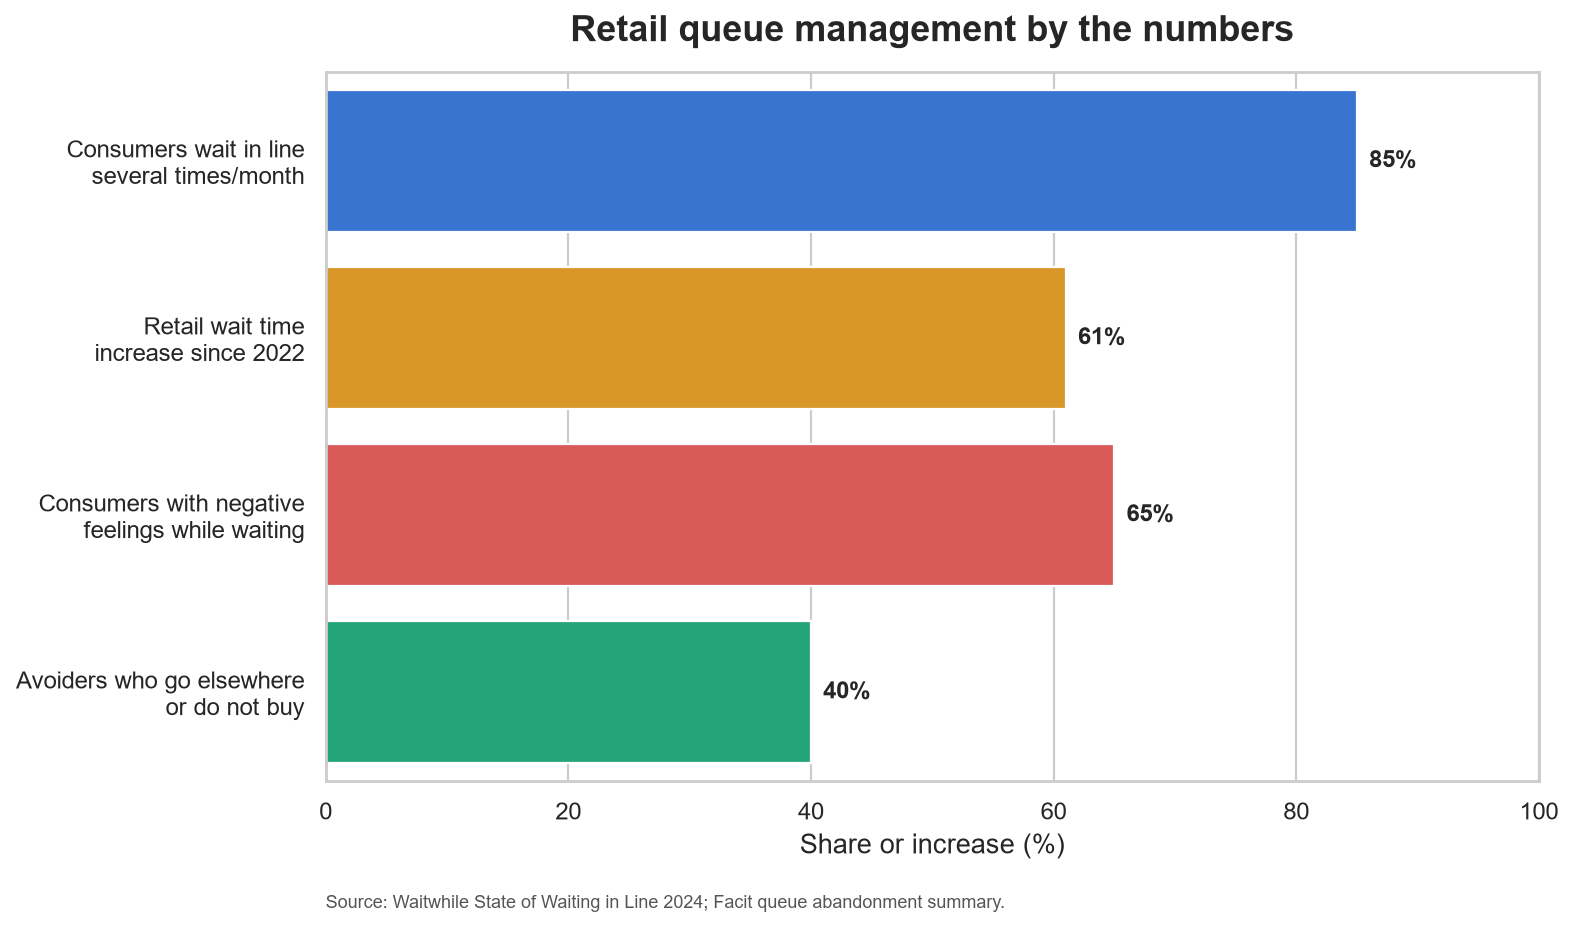
Sources: Waitwhile State of Waiting in Line 2024, Facit queue abandonment summary, BRC Crime and Shrink Benchmark 2025, Obermeier, Zimmermann, and Auinger retail queueing study.
The Detection Walkthrough
The first Horus screen is the authenticated Retail dashboard. In the captured demo state, the dashboard shows retail KPIs for customer count, conversion rate, average dwell time, active zones, live video feeds, and notifications. The local edge stream was not reachable from the browser during capture, which is why the feed panel shows the stream-unavailable state. That limitation matters: this article does not claim that a real live queue was captured in this run.
In a working edge stream, the process would start at the camera frame. Horus runs inference on the local Windows edge agent, not by sending raw video to the cloud. People detected in the checkout area are tracked through the queue zone, and the zone rule evaluates the number of people present for a defined duration. In this simulated event, the rule is:
- Zone: Checkout queue
- Trigger: Queue depth greater than or equal to 8 people
- Persistence: 12 seconds
- Alert severity: Medium
- Confidence threshold: 0.70
- Alert channel: dashboard notification, with Telegram available in live deployments
At 14:03:12, the simulated queue reaches eight people. Horus does not alert on the first frame, because a single frame can be noisy. It waits for the queue count to persist. At 14:03:24, the threshold is still breached. The modelled event is then recorded as "Queue threshold exceeded - checkout lane" with 0.86 confidence and a queue depth of eight.
The Zone Management screen is the important operational control. This is where the retailer defines what "queue" means for that camera view: the checkout footprint, the spillover lane, or a waiting area near a service counter. For MEA retailers with existing Hikvision, Dahua, Axis, or other IP cameras, this is the practical value: the store does not need a new queue sensor if the existing camera angle can see the lane clearly enough.
Once the alert fires, the Event History screen is where the event would be searchable and filterable. In the captured demo session, the table was empty, so the event row below is an illustrative row for the scenario, not a captured production record:
| Time | Event | Zone | Queue depth | Confidence | Action |
|---|---|---|---|---|---|
| 14:03:24 | Queue threshold exceeded | Checkout queue | 8 | 0.86 | Open second till |
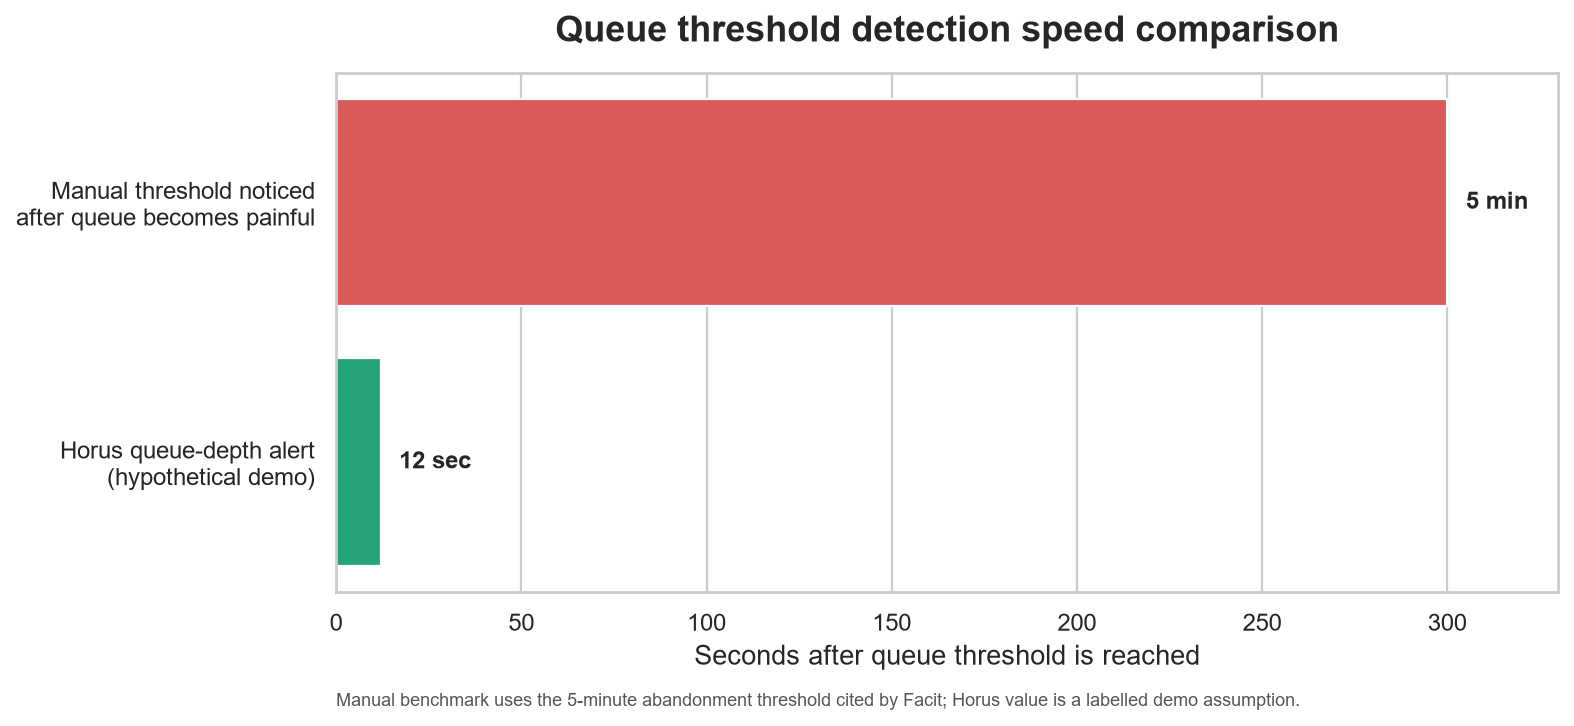
The key difference from manual observation is speed. A supervisor walking the floor might notice the line when the queue has already become painful to shoppers. Using Facit's five-minute abandonment threshold as the "too late" point, the simulated Horus alert arrives at 12 seconds after the breach, giving staff roughly four minutes and 48 seconds of intervention time before the five-minute risk window.
What The Analytics Layer Adds
Alerts solve the immediate problem. Analytics solve the recurring one.
The Retail Analytics screen in Horus includes panels for total customers, average queue wait time, active zones, conversion rate, hourly traffic patterns, zone engagement, high-activity zones, queue performance, customer heatmaps, and zone-flow analytics. For a store manager, this changes the conversation from "the queue looked bad yesterday" to "the queue crossed our eight-person threshold six times between 6pm and 8pm on Thursdays."
That historical view supports better staffing decisions. If queue spikes cluster around payday evenings, after school pickup hours, Ramadan shopping peaks, or weekend mall traffic, the retailer can adjust rotas before the next peak. If the same camera also covers entry flow or dwell zones, the team can compare queue pressure against customer arrival patterns rather than relying on memory.
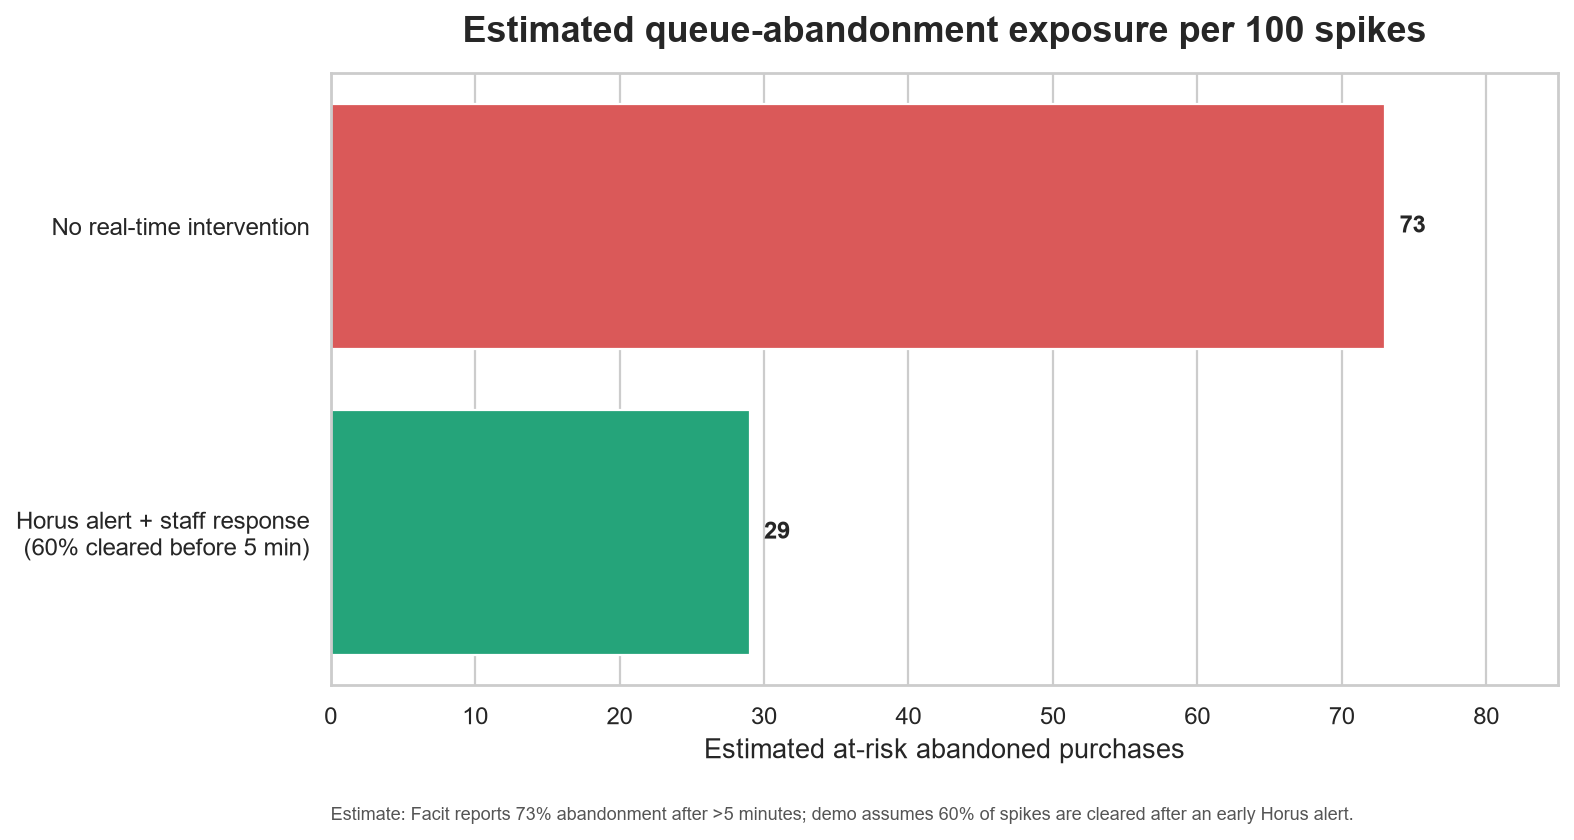
The impact estimate below is deliberately conservative and labelled as an estimate. It starts with Facit's 73% abandonment figure for queues over five minutes. It then assumes Horus alerts staff early enough to clear 60% of queue spikes before the five-minute threshold. In that model, at-risk abandoned purchases fall from 73 per 100 queue spikes to 29. This is not a guaranteed Horus result; it is the kind of operating model a retailer can test during a pilot.
What This Means In Practice
For a retail operator, the value of AI video analytics is not the dashboard itself. The value is the shorter loop between a physical event and an operational response.
With manual queue monitoring, a store often learns about congestion through shopper frustration, cashier escalation, or a manager noticing the line during a floor walk. With AI queue analytics, the queue condition becomes a measurable event. Staff can respond earlier, managers can review recurring patterns, and owners can test whether staffing changes reduce the number of threshold breaches.
Horus is built for this kind of existing-camera workflow. It plugs into IP cameras already on site, runs AI inference on a local Windows edge machine, keeps raw video on premises, and sends only detection metadata and alerts to the cloud dashboard. For retailers in Egypt, UAE, Saudi Arabia, Kuwait, and the wider GCC/MEA region, that on-premises architecture matters because camera replacement, cloud video upload, and heavy IT projects are often the blockers.
The caveat is equally important: the camera angle must be usable, the queue zone must be drawn correctly, and the alert threshold must match the store's operating reality. A small pharmacy might care about four people waiting. A large supermarket might set the threshold at eight or ten. The best pilot does not start with a generic AI promise. It starts with one queue, one threshold, one alert path, and one measurable question: did the team respond before shoppers walked away?
Conclusion
This was a hypothetical demonstration using Horus in a simulated operational environment, not a customer case study. Product screenshots are intentionally omitted because the browser session could not reach the local edge stream and no real event rows were present during capture; the queue event itself is modelled for the walkthrough.
The operational lesson is still practical. Retail queues become expensive when they are noticed too late. AI video analytics gives operators a way to turn the existing checkout camera into a threshold-based signal, a real-time alert, and a historical staffing dataset.
Want to see how Horus would perform with your cameras? Start your 14-day trial.